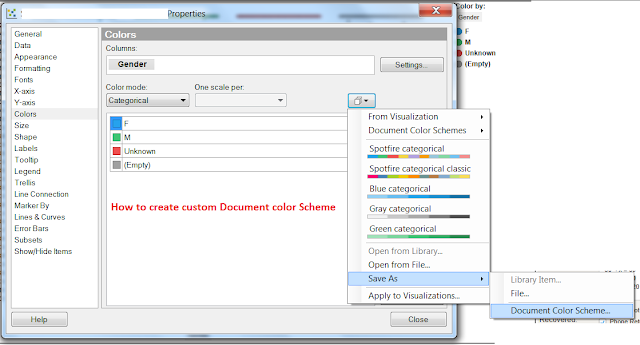
How to create custom color scheme in spotfire
My spotfire tips and tricks, Iron Python code, few do's and don'ts in spotfire...!!!
Friday, November 4, 2016
How to change a chart color scheme to not revert back to spotfire's standard categorical color scheme
The solution is to define a custom color scheme and set that as the default categorical/continuous color scheme for the particular columns you will be setting via property control.
The only catch is that this will only work if the columns are all continuous or all categorical. Mixing them will not work.
The only catch is that this will only work if the columns are all continuous or all categorical. Mixing them will not work.
- For each column you will be coloring by (all in the drop-down), save your colors as a 'Document Color Scheme
a. Select column from the property control drop-down (for example 'MyFirstColumn').
b. Change the "Color By" colors as desired (either via Legend or via visualization > Properties > Colors).
c. Right click on your visualization > Properties > Colors > Click the 'Color Schemes' button (To the right of the 'One scale per' drop-down) > Save as > Document Color Scheme...
d. Use a name like 'MyFirstColumn_Color'. - Define this color scheme as the default for this column
a. Go to Edit > Column Properties > Select the Data Column in question (for example 'MyFirstColumn').
b. Go to the Properties tab > Edit the 'DefaultCategoricalColorScheme' or 'DefaultContinuousColorScheme' Property for that column (depending on whether your column is categorical or continuous).
c. Add in the value that matches the Document Color Scheme you saved earlier (for example, 'MyFirstColumn_Color').
d. Click OK (twice) to save all changes.
Thursday, November 3, 2016
Single select list filter without none and All in spotfire
1) Create TextArea
2) Right click and "Edit TextArea"
3) Create single select list property as below as named "singleselctList"
4) Go to chart. Right click. click on properties. Go to "Data" Section. Go to Limit Data using expressions and add below.
[category] = DocumentProperty("singleselectList")
where category is a column to be filtered and singleselectList is name of list as in step 3
How to make multi-select list and use as filter in spotfire
1) Create textarea
2) Create Multiple select list as below with name vList
2) Create Multiple select list as below with name vList
3) Right click in properties for chart. Go to data properties. Go in Limit data Using expression.
([category]=$map("'${vList}'", " OR [category]=")
where category is column to be filtered. vList is name of Multiple-Select List property in step 2
Gauges in Spotfire
1) Add TextArea
2) Edit HTML
3) Add property (calculated column)
For example.
<SpotfireControl id="0e9f0a8148354db49fe6b71ad3545ccd" />
3) Add below code snippet
<style>
.regionSettings{
float:left;
width:200px;
margin:10px;
padding: 5px;
border:2px solid gray;
background:whitesmoke;
}
</style>
<div id="gauge" style="width: 200px; height: 120px;"></div>
<span id="calcValue">
<SpotfireControl id="0e9f0a8148354db49fe6b71ad3545ccd" />
</span>
4) Add js as below
//define your javascript libraries
resource=[
"//cdn.jsdelivr.net/raphael/2.1.0/raphael-min.js",
"//cdn.jsdelivr.net/justgage/1.0.1/justgage.min.js"
]
//add scripts to head
$.getScript(resource[0],function(){
$.getScript(resource[1],init)
})
//start your widget
init=function(){
var g = new JustGage({
id: "gauge",
value: parseInt($("#0e9f0a8148354db49fe6b71ad3545ccd").text()),
min: 0,
max: 5646,
title: "Visitors"
});
//refresh gauge when calcvalue changes
$(calcValue).on('DOMSubtreeModified',function(){
g.refresh($(this).text())
})
}
Subscribe to:
Comments (Atom)


